


Charts of all types, shapes and sizes are a familiar sight across the web; especially within SAAS apps, news articles, or analytics tools, and if you’re developing an application you’ve probably considered including some sort of graph or chart functionality to display data.
Getting a basic chart to display in Laravel is a simple process using a JavaScript charting solution, in this example we will be using Chart.js.
Overview:
The basics of Chart.js are pretty simple; first we need to install Chart.js into our project, depending on your project configuration you may be installing it using npm or bower, or you can link to a built version via a CDN, or clone/build from GitHub. For this quick example we’ll just be linking to the built CDN version in our example’s blade file.
A <canvas> node with an id is added to your page and then a <script> is added where the labels, dataset, colours and other settings are configured for the chart to render on the page.
You can simply hard-code all of these values into the <script> but that doesn’t make a very useful solution for dynamic data, so next we’ll look at creating data in the correct format to populate the dataset, labels and backgroundColor options.
The Data:
For this example we’ll simply chart the ages of the users in our app.
We’re assuming you have the Laravel auth scaffolding already installed and have run the necessary migrations to create a Users table. Check out the info here if not or adapt for the Model you are using for your chart data.
So firstly, we’re going to add an age column to our Users table, and then create some random users.
You can check out our article on using faker to create random Users for more detail but for this example we’ll create a database migration to add an age column by using:
php artisan make:migration --table='users' 'add_age_to_users_table'
Edit this file in /database/migrations/ to update the up function to:
Schema::table('Users', function (Blueprint $table) {
$table->int('age')->nullable();
});
Then run php artisan migrate and you should now have an age column in your Users table.
Now go to /database/factories/UserFactory and at the end of the array add:
'age' => $faker->numberBetween($min = 20, $max = 80),
So the whole return is:
return [
        'name' => $faker->name,
        'email' => $faker->unique()->safeEmail,
        'email_verified_at' => now(),
        'password' => '$2y$10$92IXUNpkjO0rOQ5byMi.Ye4oKoEa3Ro9llC/.og/at2.uheWG/igi', // password
        'remember_token' => Str::random(10),
        'age' => $faker->numberBetween($min = 20, $max = 80),
    ];
We need to create a UsersTableSeeder, so run:
php artisan make:seeder UsersTableSeeder
This will create /database/seeds/UsersTableSeeder.php
Add the following to the run function:
factory(App\User::class, 5)->create();
When run, this will create 5 users, change 5 to any number of users you require.
Then we need to go to /database/seeds/DatabaseSeeder.php and uncomment the code in the run() function.
Finally, run php artisan db:seed and we should have 5 new users, all with ages.
Now we’re going to create a model, controller, views and routes for our Charts page.
First run php artisan make:controller ChartController --model=Chart
Add the following to the /app/Http/Controllers/ChartController.php:
use App\User;
use App\Chart;
use DB;
...
public function index()
    {
// Get users grouped by age
$groups = DB::table('users')
                  ->select('age', DB::raw('count(*) as total'))
                  ->groupBy('age')
                  ->pluck('total', 'age')->all();
// Generate random colours for the groups
for ($i=0; $i<=count($groups); $i++) {
            $colours[] = '#' . substr(str_shuffle('ABCDEF0123456789'), 0, 6);
        }
// Prepare the data for returning with the view
$chart = new Chart;
        $chart->labels = (array_keys($groups));
        $chart->dataset = (array_values($groups));
        $chart->colours = $colours;
return view('charts.index', compact('chart'));
    }
The random colour code is an example of how you can do interesting things with the data in the controller, and you can specify hardcoded colours if you prefer.
If you need hosting for your Laravel projects, we like DigitalOcean, you can get $100 hosting credit to try it out if you sign up via this link.
Now we need to create an index.blade.php in /resources/views/charts/ and add the following (depending on your blade setup and layout — this is an example):
<!doctype html>
<html lang="{{ str_replace('_', '-', app()->getLocale()) }}">
    <head>
      <meta charset="utf-8">
     <meta http-equiv="X-UA-Compatible" content="IE=edge">
     <meta name="viewport" content="width=device-width, initial-scale=1">
<title>Laravel Chart Example</title>
        <!-- Bootstrap CSS -->
       <link rel="stylesheet" href="https://stackpath.bootstrapcdn.com/bootstrap/4.3.1/css/bootstrap.min.css">
       <!-- Fontawesome CSS -->
</head>
      <body>
<div class="container">
      <div class="row">
          <div class="col-md-12">
              <div class="panel panel-default">
                  <div class="panel-heading my-2">Chart Demo</div>
                    <div class="col-lg-8">
                                            <canvas id="userChart" class="rounded shadow"></canvas>
                  </div>
              </div>
          </div>
      </div>
  </div>
<script src="https://code.jquery.com/jquery-3.4.1.min.js"></script>
  <script src="https://cdnjs.cloudflare.com/ajax/libs/popper.js/1.14.7/umd/popper.min.js"></script>
  <script src="https://stackpath.bootstrapcdn.com/bootstrap/4.3.1/js/bootstrap.min.js"></script>
<script src="https://cdn.jsdelivr.net/npm/chart.js@2.8.0"></script>
<!-- CHARTS -->
<script>
    var ctx = document.getElementById('userChart').getContext('2d');
    var chart = new Chart(ctx, {
        // The type of chart we want to create
        type: 'bar',
// The data for our dataset
        data: {
            labels:  {!!json_encode($chart->labels)!!} ,
            datasets: [
                {
                    label: 'Count of ages',
                    backgroundColor: {!! json_encode($chart->colours)!!} ,
                    data:  {!! json_encode($chart->dataset)!!} ,
                },
            ]
        },
// Configuration options go here
        options: {
            scales: {
                yAxes: [{
                    ticks: {
                        beginAtZero: true,
                        callback: function(value) {if (value % 1 === 0) {return value;}}
                    },
                    scaleLabel: {
                        display: false
                    }
                }]
            },
            legend: {
                labels: {
                    // This more specific font property overrides the global property
                    fontColor: '#122C4B',
                    fontFamily: "'Muli', sans-serif",
                    padding: 25,
                    boxWidth: 25,
                    fontSize: 14,
                }
            },
            layout: {
                padding: {
                    left: 10,
                    right: 10,
                    top: 0,
                    bottom: 10
                }
            }
        }
    });
</script>
</body>
</html>
Finally in /routes/web.php we need to add the following: Route::get('/charts', 'ChartController@index')->name('charts');
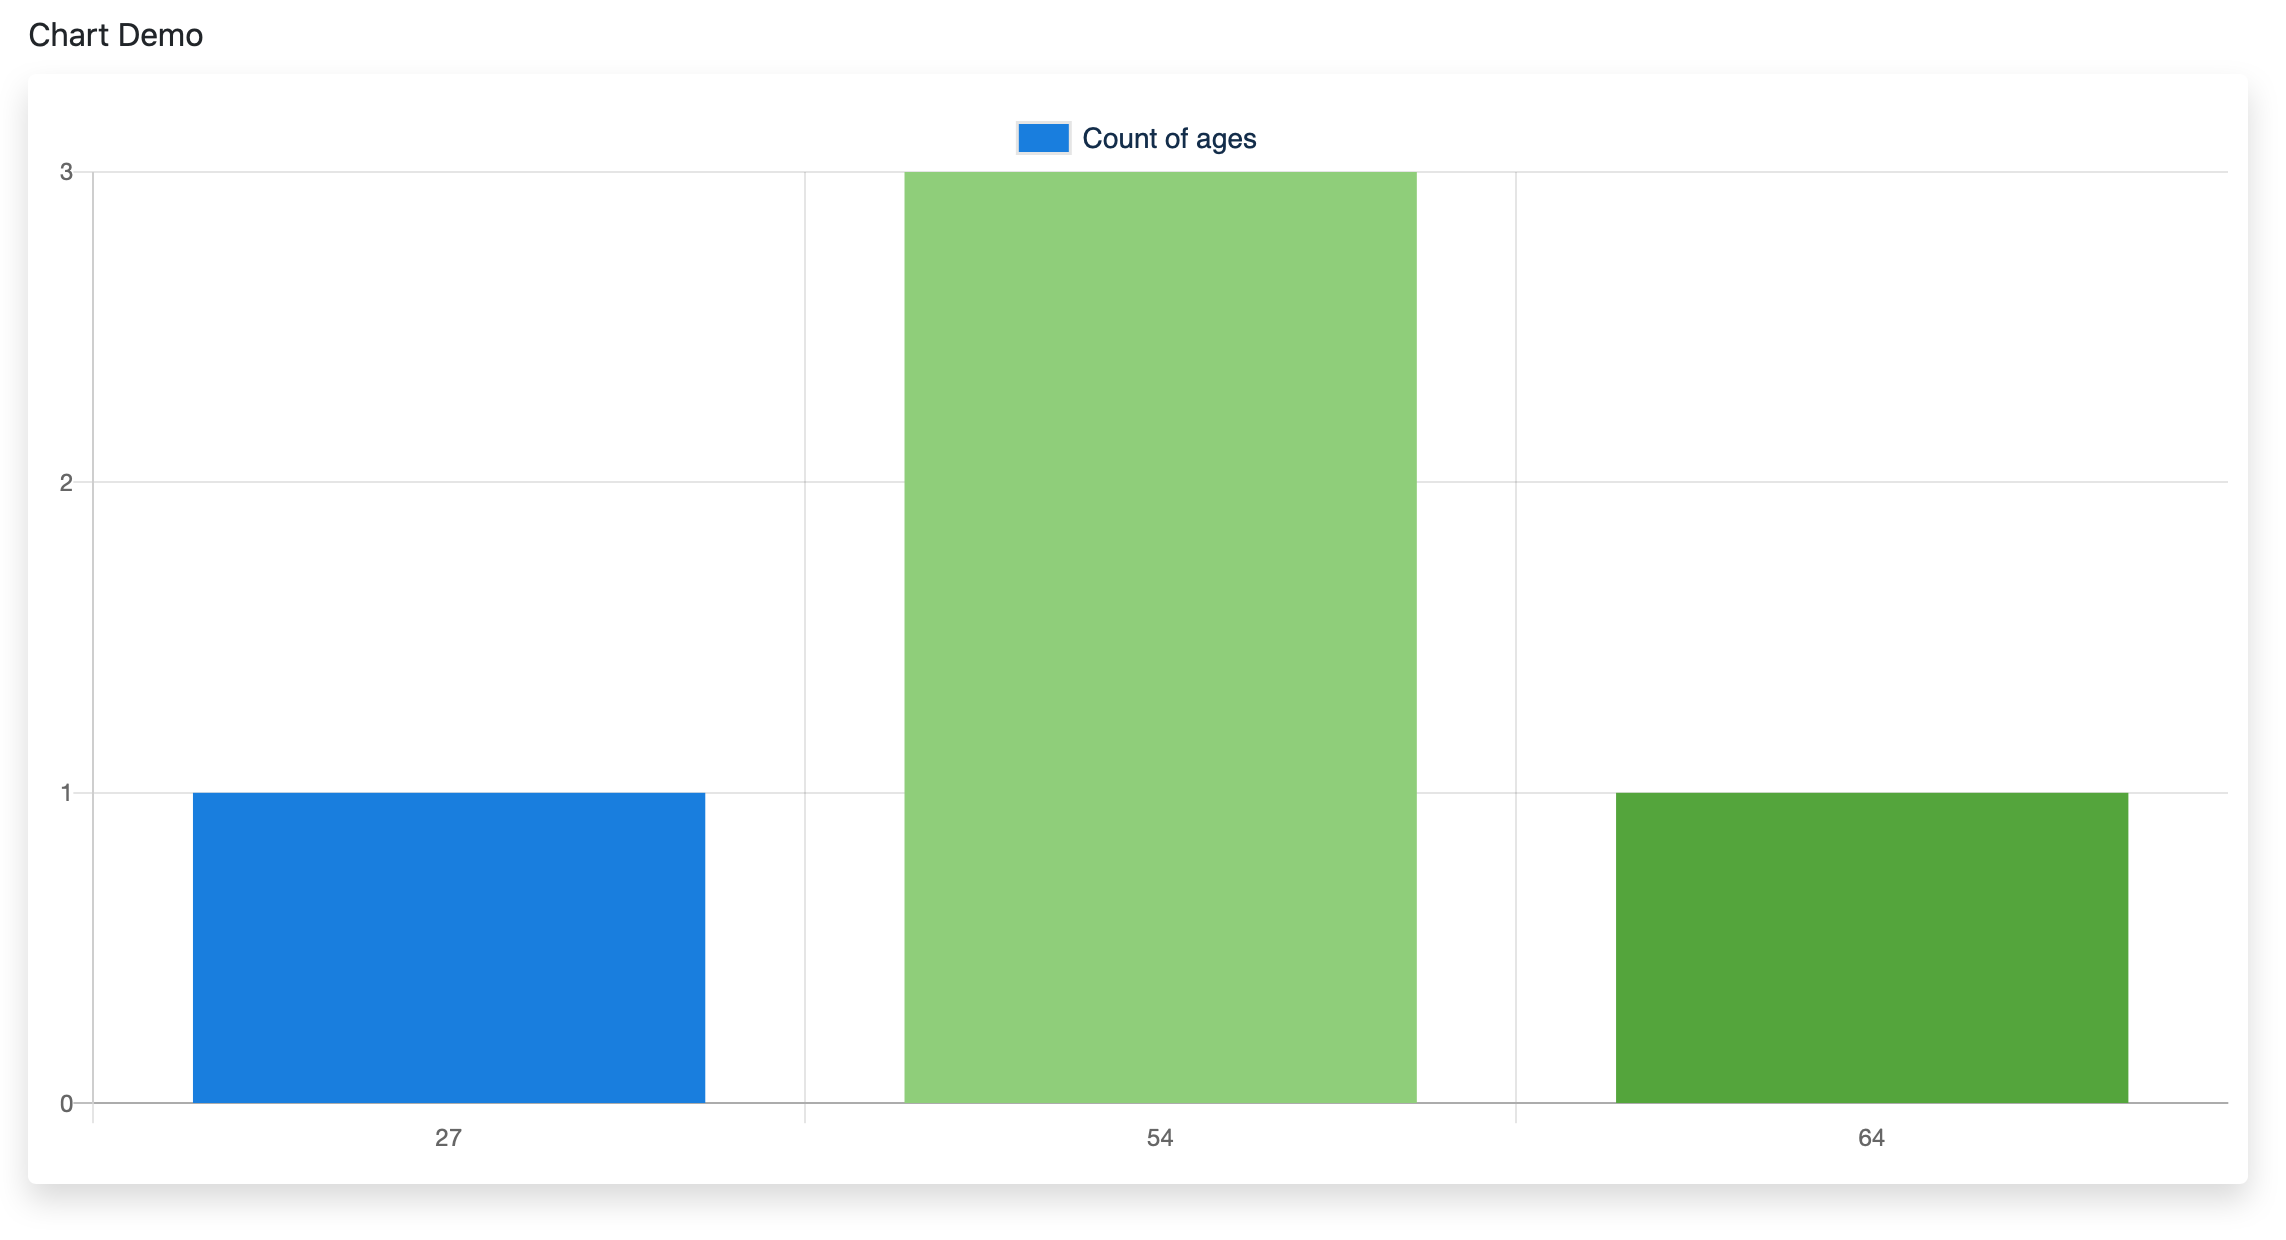
Now go to your-project-name.test/charts and you should see something like the following:
You can check out the Chart.js docs for further information on customising your charts but hopefully this gives you a starting point to understand the basics of charts and graphs in Laravel.